Seasonality Is Screwing Up Your Business’s Data. Here’s How To Fix It!
It’s official: the holidays are over and a new decade has begun. To some, it marks the end of the biggest marketing campaign of the year.
But now it’s time to analyze the data, and you can clearly see that sales have skyrocketed from November through to December. But when you think about it, haven’t sales skyrocketed every December?
Well, yes. But not because your campaign was a smashing hit every year, but rather because of a little pesky phenomenon: seasonality.
If you’ve ever been to a mall at different points in the year, you’ve likely already seen the effect. Come during the holiday season and shoppers will flood the stores, eager to grab the best deals. Come back a few months later and you might find the same mall deserted.

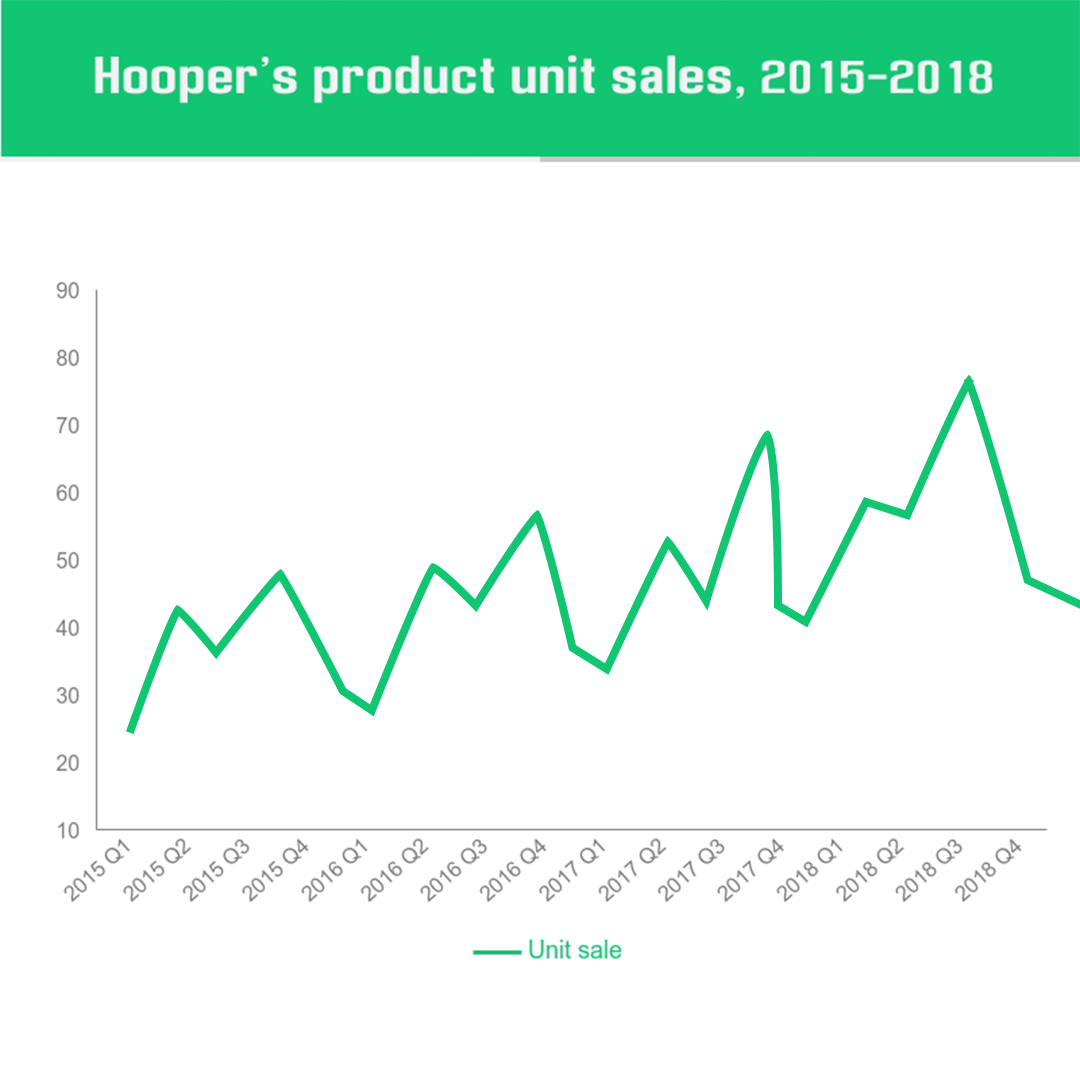
“So what?” you might be thinking. Well, here’s the problem. Below is a diagram of a business’s product sales throughout the year. As expected, sales soar during the holiday season every year. But point to a specific point on the graph. If you take away the seasonal factor, how well do you think the business was performing at this point in time?

It isn’t that easy, is it? The truth is, without knowing how well your business is really doing, you’ll have no idea whether that sales spike is simply the product of the holiday season or an actual achievement to be celebrated. As a result, poor data quality contributes to $15 million in losses every year, according to Gartner.
So how do we combat seasonality and have data thatès actually representative of the business’s impact on sales and revenue? Well, there are several ways, but I’m going to highlight two in this article: year-over-year analysis and seasonal adjustment.
Year-over-year (YoY) analysis
This is the easiest way to eliminate the effect of seasons; you’ve probably heard of it. Year-over-Year analysis looks at how a month fared compared to previous years, rather than the month before. In other words, you get more of an apples-to-apples comparison when you’re comparing multiple Christmas campaigns than if you simply measure the before and after.

This simple strategy works and many businesses implement it, but it does have its drawbacks. It doesn’t provide very much information since it can’t explain why your business is experiencing growth. Moreover, it won’t be very noticeable if one month in particular is doing better or worse than average if the only thing you’re looking at is the same month of previous years. YoY analysis is great for discerning long term trends, which makes it not so effective at measuring short term performance without being coupled with other methods of measurement.
How to Calculate YoY Growth Rate
- Take this month’s growth and subtract it by the growth measured in the same month last year. (e.g. 225 sales this December minus 206 last December is 19)
- Divide the resulting number by last year’s metric. (e.g. 19 divided by 206 is 0.092)
- Multiply that number by 100 (e.g. 0.092 x 100 = 9.2, meaning there is a 9.2% growth from last year.)

Adjusting for seasonality
In this method, we’re actually modifying the data to remove the seasonal component of the time series. It means that that line that looks like a heart rate monitor now resembles a flat terrain, as illustrated below, and you can be sure that any dip or hump on the graph represents how your business is actually performing.
Well, for the most part.
As effective as seasonal adjustment is, it doesn’t come without a cost. When your business experiences a rare financial crisis, for instance, your data will get messed up as it’ll add numbers where they shouldn’t be added, giving the illusion that your business is fine.

The Manual Method
The simplest way to seasonally adjust your data requires Excel and no new knowledge. I won’t give an in-depth explanation, but there’s a great YouTube video walking through the process here if you’d like to try it out for yourself.
You’re basically calculating the ratio of something for one month to the monthly average of the entire year (6 months prior to 6 months after). In other words, to calculate the seasonal ratio for sales in December, you take December’s sales and divide it by the average number of monthly sales from June last year to June next year.
Now let’s say you had 266 sales in December, and the monthly average was 194. Dividing the two gets you roughly 1.37, which means that you’re getting 37% more sales than normal in this December. Do the same for the previous Decembers and average them all together, and you’ll get the unadjusted factor.

To get the number of sales seasonally adjusted, simply divide the number of sales by the unadjusted factor.
There are a number of benefits to this method, the main one being its simplicity. You don’t need to know R, a programming language for statistical computing. Anyone can learn it. However, it does have its flaws.
Remember that we calculated the seasonal ratio for December by averaging them all together. When Bill Conerly did the same for retail sales of sporting goods, he noticed that instead of hovering around the same value, the December ratios were trending downward over time. Averaging these values into one number wouldn’t accurately represent this phenomenon.

So how do you factor in this long-term trend and other complexities into your seasonal adjustment calculations?
Using seasonal adjustment software
Now if you don’t have much statistical background, I’d wouldn’t advise tackling this route yourself unless you have the time and reason. But by using statistical software, you’ll be able to paint a more accurate picture of your business’s performance.
The United States Census Bureau provides a free open-sourced seasonal adjustment software called X-13ARIMA-SEATS, which you can use in Microsoft Excel or any statistics program, as well as on this website.

It has a few nifty features, such as identifying outliers and accounting for moving holidays like Easter and Chinese New Year, as well as accounting for irregular components that may exist in your dataset. But in exchange for accuracy, it takes more time to do as well. If your business relies heavily on data and analytics, however, the benefits of seasonally adjusting your data will far outweigh its initial costs.
What’s next?
Now that I’ve laid out some options for you, the method that works best for you is your choice. Maybe you’re a small company with little data and you’d rather compare this year’s holiday campaign to last year’s. Maybe you’re heavily reliant on data and investing in seasonal adjustment will benefit you.


